Home prices rose on a month-over-month basis for the 16th consecutive month in May the Federal Housing Finance Agency (FHFA) said today Prices reflected in the agency’s Home Price Index (HPI) were estimated to have increased 0.7 percent from mid-April to mid-May. The April HPI was revised downward from the 0.7 percent originally reported to 0.5 percent.
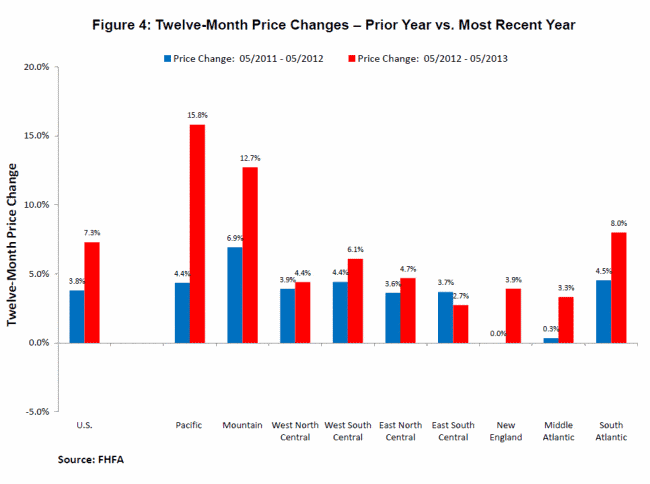
National home prices rose 7.3 percent on an annual basis in May with an index of 201.8 compared to 188.1 in May 2012. Annual increases in six of the nine census regions were below the national average and five were at least 2.5 percentage points below that average. The Pacific region (Hawaii, Alaska, Washington, Oregon, California) had a 15.8 percent increase and the Mountain region (Montana, Idaho, Wyoming, Nevada, Utah, Colorado, Arizona, New Mexico) was up 12.7 percent, thus heavily skewing the national average.

The Mountain region however, faltered in May, losing .01 percent on the HPI after a 1.9 percent increase in April. The only other region with a negative change in May was the East South Central Region (Kentucky, Tennessee, Mississippi, Alabama), down 1.5 percent after an 0.8 percent gain the previous month That region also had the smallest annual gain, 2.7 percent. The strongest month-over-month showings were in the West South Central (Oklahoma, Arkansas, Texas, Louisiana) and Middle Atlantic (New York, New Jersey, Pennsylvania) regions each of which increased 0.9 percent.
FHFA’s HPI is a weighted, repeat-sales index using information obtained by reviewing repeat mortgage transactions on single-family properties whose mortgages have been purchased or securitized by Fannie Mae or Freddie Mac since January 1975. The HPI is updated each quarter as additional mortgages are purchased or securitized by Fannie Mae and Freddie Mac. The new mortgage acquisitions are used to identify repeat transactions for the most recent quarter and for each quarter since the first quarter of 1975.
SOURCE: www.mortgagenewsdaily.com


