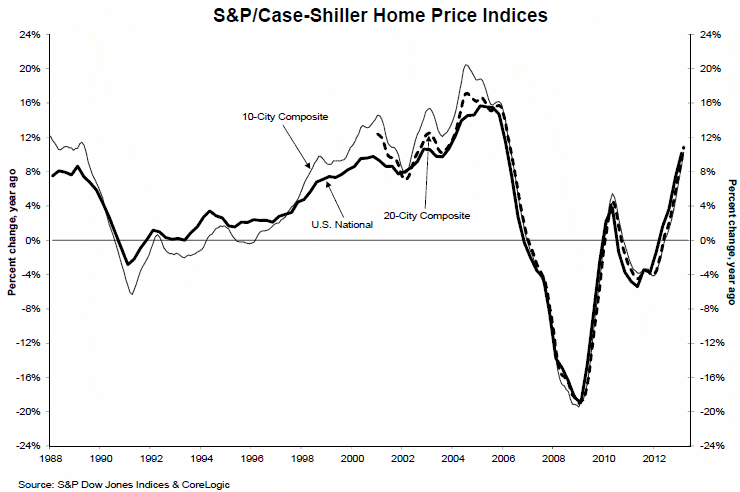
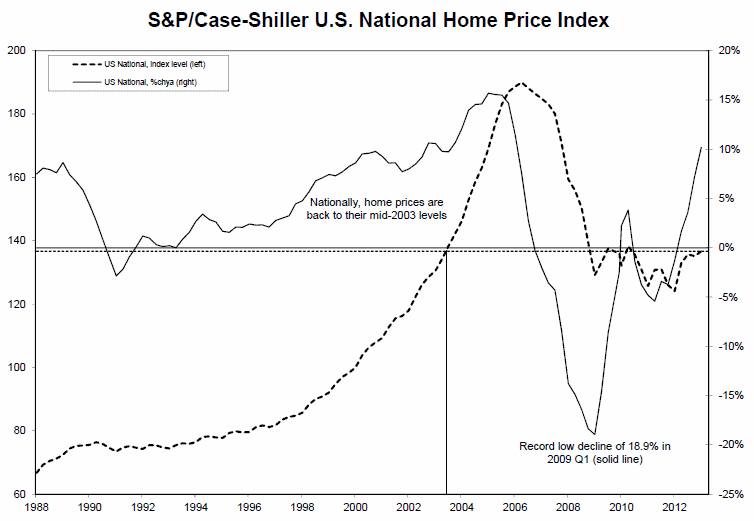
The S&P Case-Shiller U.S. National Composite index which covers the nine Census Districts rose by 1.2 percent in the first quarter compared to the fourth quarter of 2012 and was up 10.2 percent year-over-year. Both the 10-City and the 20-City Indices gained 1.4 percent from February to March; the 10-City was up 10. 3 percent on an annual basis and the 20-City was up 10.9 percent.

“Home prices continue to climb,” David M. Blitzer, Chairman of the Index Committee said. Home prices in all 20 cities posted annual gains for the third month in a row. Twelve of the 20 saw prices rise at double digit annual growth. The National Index and the 10- and 20-City Composites posted their highest annual returns since 2006.”
There were some notable month over month increases. San Francisco was up 3.9 percent, Seattle 3.0 percent, and Las Vegas and Portland, Oregon both rose 2.7 percent. Only two cities posted price decreases from February to March; Minneapolis was down 1.1 percent and New York down 0.4 percent. Prices in Chicago and Cleveland were unchanged.
All 20 cities had positive year-over-year changes and all have shown annual increases for at least three consecutive months. Blitzer called even the weakest gains in New York (2.6 percent), Cleveland (4.8 percent), and Boston (6.7 percent) “substantial.” The strongest gains were seen in Phoenix (22.5 percent), San Francisco (22.2 percent), and Los Vegas (20.6 percent.)
As of March, average home prices across the U.S. are back to their late 2003 levels for both the 10- and the 20-City Composites. Measured from the June/July 2006 peaks, the peak-to-current decline for both Composites is approximately 28 to 29 percent and they have recovered from their respective troughs in March 2012 by 10.4 for the 10-City and 10.9 percent for the 20-City.

“Other housing market data reported in recent weeks confirm these strong trends; housing starts and permits, sales of new homes and existing homes continue to trend higher,” Blitzer said. “At the same time, the larger than usual share of multi-family housing, a large number of homes still in some stage of foreclosure, and buying-to-rent by investors suggest that the housing recovery is not complete.”
The S&P indices combine matched price pairs for thousands of individual houses from the available universe of arms-length sales data. The National Composite is issued quarterly based on information for the nine census districts. The 20- and 20-City Indices are value-weighted averages. Each has a base value of 100 in January 2000. Therefore a current index of 150 translates to a 50 percent appreciation in price since that date.
SOURCE: www.mortgagenewsdaily.com


